 ) from the tool bar. From the properties dialog choose the Data tab and configure data coverage, update interval, and number of primary samples. Save your changes by pressing OK.
The Monitor tool is used to collect numerical and other values from one or more targets and store them in a round robin database. The collected numerical values can be recomputed based on spreadsheet like formulae. The collected and computed values can then be displayed graphically as 2D charts or 3D charts.
New in version 3: The round robin database can be stored in relational databases using Java Database Connectivity (JDBC). Currently IBM® DB2® 9.7 or later1 and PostgreSQL are supported out-of-the-box.
Data is collected on demand or periodically in the, so called, primary round robin database with configurable number of samples, start time, and refresh interval. Each monitor has exactly one primary round robin database.
The collected data can be consolidated based on consolidation functions like AVERAGE, MAX, MIN, LAST, and SUM into secondary round robin databases. A monitor can be configured to have an arbitrary number of such consolidation round robin archives.
For each primary data point, regardless whether it is a collected or a computed one, an alarm configuration can be specified. Each alarm configuration consists of a boolean expression which raises the alarm and optionally another boolean expression which clears the alarm. Alarms are logged in the MIB Explorer logging system with a configurable severity.
In addition, MIB Explorer may be configured to execute scripts to generate traps, notifications, and informs, as wells as to send emails or execute system commands if one of the configured raise or clear alarm conditions becomes true.
Using the email feature of the logging system, alarms and other log entries may be forwarded to an arbitrary email address.
Primary and secondary round robin databases as well as the corresponding charts may be exported to XLS and CSV files (tabular data) or JPEG, PNG, PDF, PS, and PCL graphic files (charts) whenever data is updated periodically. The monitor configuration and data can be automatically saved as XML or an internal binary file whenever its data has been updated.
Monitors can be run on a headless server as a background service using the MIB Explorer Server. See “Server (Pro Edition)” on page 98.
MIB Explorer instances can then connect to the server via TCP/IP and configure, watch, stop, and run monitor instances on the server.
Monitor examples can found in the examples/monitor directory of the MIB Explorer installation.
MIB Explorer can be configured to run an internal HTTP server that, besides others, may serve requests for monitor data. There are two different servlets that can be enabled: a chart and a data servlet. The first generates chart images of the requested monitor on the fly and the second generates a HTML page using a default or an user configured Velocity template from the monitors data.
18.1Basic Monitoring Operations
MIB Explorer provides means to easily create Monitors with the Monitors tab from the info panel. Monitors can be used for the following purposes:
Collecting numerical SNMP data over a long time period and optionally compute additional values based on the collected data.
Displaying collected or computed data as plot, bar, area, and pie charts. Alternatively, collected data can be also displayed as 3D bar, surface, and scatter plot charts.
Exporting data and charts to XLS, CSV and JPEG, PNG (as well as 2D charts to PDF, PS, and PCL) files.
Generating SNMP traps/ informs and log entries on configurable alarm conditions.
Run MIB Explorer scripts to spawn external processes, send emails, or send SNMP requests.
To Create a New Monitor
1.Select the Monitors tab from the main window's Tools panel.
2.Press the New button to create a new Monitor. If you want to create a monitor with 3D chart display like 3D bars, surface, or scatter plot, then press the New 3D button instead. A new Monitor will be created and displayed on the right hand side.
3.Configure the Monitor
To Open a Monitor
1.Select the Monitors tab from the main window's Tools panel.
2.Press the Open button to open a previously saved Monitor from disk.
3.Select the PDU file in the file open dialog and press Open. The corresponding Monitor will be displayed on the right hand side.
To Save a Monitor
1.Select the Monitor to save in the Monitors tab.
2.Press the Save or Save As button. A file selection dialog will be displayed in the latter case or if the monitor has not been saved yet or the file is no longer accessible.
Select a file or enter a new filename to save the Monitor to. The monitor will be saved in XML format if the file name's suffix is ".xml" or ".XML". It will be saved into a relational database if the suffix is ".dbm" or ".DBM". Otherwise the internal binary format will be used. The XML schema of the monitor configuration file can be found in the xsd directory of the MIB Explorer Pro installation.
3.For DBM monitors, you now have to enter the database connection parameters. See “DBM Monitor Operations” on page 115.
4.Press OK. When the monitor is saved successfully, the change list will be cleared.
To Close a Monitor
1.Select the Monitor to save in the Monitors tab.
2.Press Close. If there are any unsaved changes, you will be prompted for saving them.
To Convert a Monitor from 2D to 3D Charts or Vice Versa
1.Select Monitors tab from the main window's Tools panel.
2.Press the Convert... button to open an existing monitor which will then be automatically converted to from 2D to 3D or from 3D to 2D charts depending on the type of the opened monitor.
3.The converted monitor will be displayed on the right hand side. Check the properties of the monitor in order to adjust any settings.
To View, Stop, or Run a Monitor from a Remote (DB) Server
1.Select Monitors tab from the main window's Tools panel.
2.Press the Connect... button. You will be then prompted to enter the host name of the MIB Explorer Server or the JDBC DB connection URL of the relational MIB Explorer database you want to connect to.
3.If the server is available and your client host is allowed to connect to the server, a dialog that lists the running monitors on that server will be opened. Otherwise an error message will be displayed. By having successfully connected to the server you can:
1.Press the Run... button of the dialog to start a monitor from the server's monitor directory remotely.
2.Press the Stop... button to stop the selected monitor on the server. This will also stop all remotely connected monitors since data collection is done by the server process not the clients. The text „Monitor has been stopped on server“ will be then displayed on all connected monitors.
3.Select a monitor and then press the Connect button to open the selected monitor from the remote server. By opening a remote monitor, all configuration and collected data will be transferred (unencrypted) to the local MIB Explorer process via a TCP/IP connection and the monitor will be set into run mode. While in run mode, updates on the data of the server monitor will propagated to the local (client) monitor. Its data and charts will be updated accordingly. If the monitor's settings are changed so that the changes are incompatible with the server monitor, then the local monitor will be automatically disconnected from the server2. The local version might then be (re)deployed (see below) to the server to replace the original one or to start a new copy on the server.
To Deploy a Monitor to a Server
1.Open or create a monitor as described above.
2.Press the Deploy... button. You will be then prompted to enter the host name of the MIB Explorer Server or the JDBC URL of the relational MIB Explorer database.
3.If the entered MIB Explorer server could be contacted you will be prompted to enter the name of the monitor on the remote server.
4.Press OK to start the monitor on the server. The local monitor will be automatically connected to the deployed instance on the server. The monitor configuration and data will be saved to the monitor path of the server.
If you deployed the monitor to a database, the monitor cannot run itself on the database server. The data will be collected locally and then stored remotely into the database.
To store a monitor configuration (and data) on a database it is recommended to use Save as instead Deploy.
To Restart Open Monitors When MIB Explorer is Run Next Time
1.Select Monitors tab from the main window's Tools panel.
2.Open all monitors that should be run the next time MIB Explorer or MIB Explorer Server is started following the instructions above.
3.Select the "Restart Next Time" checkbox.
4.Exit MIB Explorer at any later time without opening or closing monitors meanwhile.
5.If MIB Explorer Server is run then, the monitors will be started from the location where they were opened under (2). If MIB Explorer Pro is started, then you will be prompted at startup whether you want to run the monitors. If you confirm, the monitors are loaded and started otherwise they are loaded only.
This section describes the characteristics of the basic monitor operations for monitors stored on relational databases. Whereas the classic MON and XML monitor files store configuration and data in a single file on the local file system, the DBM monitor files contain only database access information. Configuration and data of the DBM monitors are stored in the associated relational database.
The typical content of a DBM monitor file is:
jdbc.url=jdbc\:postgresql\://localhost\:5432/mxp
jdbc.driver=org.postgresql.Driver
monitor.id=1
monitor.name=InterfacesIO_PostgreSQL.dbm
# Add the following lines if you do not want to
# get prompt for user and password when opening
# the monitor file (required on a MIB Explorer Sever).
# Alternatively, for most JDBC drivers, you can also
# add user and password in the jdbc.url.
user=foo
password=bar
The above configuration would access a database named mxp in the PostgreSQL database server at the localhost on port 5432. The monitor.id property selects a monitor with the ID 1 from the monitors in the database. If you do not know the monitor ID, you can specify the monitor.name property only. MIB Explorer will then try to lookup the ID by the name.
Any changes to the configuration or the collected data of a DBM monitor are saved and committed immediately to the database. It is not necessary to save the DBM file to commit any changes.
The monitor panel is divided into three regions: the tool bars at the top, the view navigation tree on the left, and the view itself on the right (configuration, table, or chart).
To configure a Monitor
1.Create a new monitor as described here or open one as described here.
2.Select the target you want to monitor and make sure that all MIB objects (modules) you want to monitor are loaded.
3.Select the Configuration node from the navigation tree of the monitor panel.
4.For each object to be monitored, select it in the tree (preferably the corresponding instance) and drag it into the configuration table. A new row will be created with the name of the MIB object. In case you have dragged an OBJECT-TYPE definition, its OID will be filled into the OID/Formula column of the new series. If the dragged object is an instance of an OBJECT-TYPE, then the Index column will be filled with the index portion of the instance's OID.
5.Add additional rows to the table if you need to compute any values from the collected ones above. Enter a formula beginning with an equals sign ("=") into the OID/Formula column. After the equals sign, enter an arithmetic expression.
6.Choose the properties button () from the tool bar. From the properties dialog choose the Data tab and configure data coverage, update interval, and number of primary samples. Save your changes by pressing OK.
The above steps are sufficient to setup basic monitors. However, in many situations you may need to use some of the advanced monitoring features:
Index Calculation
Customized Legend
Alarm Configuration
How to configure these features is described in the following sub-sections.
18.2.1Monitoring Series Configuration Matrix
The Configuration node of the Monitor navigation pane displays the monitoring series configuration matrix on the content pane. This table specifies which data is monitored and which series of the monitored data is displayed in the associated charts. The table below describes the columns of the series configuration matrix.
|
Column |
Description |
|---|---|
|
Name |
The name of the series. If the Legend column is empty, then the series name will be used in the chart legend instead. |
|
Target |
The target from which data is retrieved for this series. If the target field is empty, then data is retrieved from the current target configured for MIB Explorer. |
|
OID/Formula |
The OID of the OBJECT-TYPE definition (without any index portion) that defines the data to be collected. The OID may be specified as dotted string of positive integers, for example 1.3.6.1.2.1.2.2.1.10, or as a combination of object name and a numerical dotted string, for example ifInOctets or ifTable.1.10. Instead of collecting the series from a target it may also be computed based on other values in the primary round robin database by specifying a formula instead of an OID. A formula begins with an equals sign ("="). After the equals sign, an arithmetic expression has to be entered. The evaluation of formulas is done for a row left to right when all "OID" data points have been retrieved (even if an error occurred). |
|
Index |
The index portion of the OID that identifies the OBJECT-TYPE instance to retrieve data from, for example 1 (index has Integer32 syntax) or 127.0.0.1 (index has IpAddress syntax). In addition to simple OID string any type of OID string expression can be entered as formula (thus, the leading equals sign ("=") is required), for example: ="1"+indexof(ifName, "eth0.*"). If the OID/Formula column contains a formula, then this column will be ignored. |
|
Display |
Specifies whether this series is displayed in chart views. Series with data retrieved from OBJECT-TYPES with a syntax other than Integer, Counter, TimeTicks, Gauge, and Counter64 must not be displayed. Such series may only be used to reference them from chart name or legend templates. |
|
Legend |
Specifies the text to be displayed for this series in the chart's legend. The text may include an arbitrary number of formatted arithmetic expressions enclosed in brackets { and }. For example, "Foo Average {FORMAT(AVERAGE(Z?:Z0), "#,##0")}" prints the average over all data points in the series Foo as Foo's legend. |
|
Alarm |
The alarm column indicates whether alarm checking is enabled, disabled, or not present (no alarm) for this series. To configure an alarm for this series, select the corresponding row by clicking on the row's label and then pressing the right-mouse button to open the context menu. There choose Configure Alarm. |
Sending SMTP E-mails is support with password protected SMTP servers too.
It is often useful to generate an alarm when a value crosses a certain boundary, for example if the free disk space is lower than a predefined value or percentage. MIB Explorer provides means to raise and clear an alarm dependent on respective boolean expressions for each series of a monitor configuration. An alarm can be simply logged or a script can be executed, which may send a trap/inform SNMP message when the alarm is triggered. Logged alarms may easily be forwarded to an email address by configuring an email appender.
To Configure an Alarm
1.Within the monitor configuration table, select the row (series) that should be watched for an alarm condition by clicking on the row label.
2.Press the right mouse button to open the context menu.
3.Select Configure Alarm to open the Alarm Configuration dialog, which is described below.
4.Select Log Severity and enter at least a Raise Condition.
5.Press OK to save your changes. The alarm is then enabled.
To Disable an Alarm Watch
1.Select a row (series) in the monitor configuration with an enabled alarm status.
2.Press the right mouse button to open the context menu.
3.Select Disable to disable the alarm watch. No alarms will be generated for this series until it is enabled again.
To Enable an Alarm Watch
1.Select a row (series) in the monitor configuration with an disabled alarm status.
2.Press the right mouse button to open the context menu and select Enable to enable the alarm watch. From now on, alarms will be generated for this series if the corresponding conditions are met.
To Remove an Alarm
1.Select a row (series) in the monitor configuration with a disabled or enabled alarm status.
2.Press the right mouse button to open the context menu and select Remove to remove the alarm watch.
18.3.1Alarm Configuration Dialog
Target
The alarm target for scripts executed on behalf of this alarm. This field has no effect, if Type is set to Log Only. The special target "MIB Explorer" sends alarms to the MIB Explorer's trap receiver using UDP transport. The alarm target which will be configured when "MIB Explorer" is selected, is the first entry in the list of trap listener addresses/ports.
Severity
Specifies the log priority (severity) to be used for logging events generated on behalf of this alarm. This is also the severity returned within the alarm context of alarm scripts.
Raise
Condition
The boolean expression which raises the alarm when true. Unless a Clear Condition is also provided, the alarm is transient. Thus, it will be raised whenever the raise condition evaluates to true. When a Clear Condition is given, the alarm will be raised only once. Before it could be raised again, the clear condition has to be true at least once.
Script
Specifies a MIB Explorer script to be executed when this alarm is raised. Besides the normal script contexts snmp, mib, and utils there is also the alarm context supported, which provides an interface to access alarm and monitor data from within the script.
Note: The gui context is not supported in alarm scripts!
There are two example alarm scripts available from the examples directory: alarm.vm and alarm_email.vm. The first can be used to send a SNMP notification when an alarm is raised or cleared whereas the second can be used to send an E-mail using (un-)authenticated SMTP. See the MIB Explorer Script API documentation for details.
If the Embed Script check box is selected, the supplied script file will be copied into the alarm configuration. This is particularly useful when a monitor should be run on a server or distributed to other MIB Explorer instances, because one need not to deploy the script file separately. A disadvantage of using embedded scripts is the fact that embedded scripts cannot be changed by changing a single file per MIB Explorer instance.
With Edit, an embedded script can be viewed and changed.
To test a script, click on the Test button and the supplied script will be executed as if the given condition would be true. The values presented to the script are taken from the most recent row of the primary values table.
Clear
Condition
Specifies the boolean expression which clears the alarm when true. By providing a clear condition an alarm is non-transient. Clear Condition and Raise Condition have to be mutually exclusive.
Script
Specifies a MIB Explorer script to be executed when this alarm is cleared. In most cases, this will be the same script as for the Raise Condition. Besides the normal script contexts snmp, mib, and utils there is also the alarm context supported, which provides an interface to access alarm and monitor data from within the script.
Note: The gui context is not supported in alarm scripts!
See the MIB Explorer Script API documentation for details.
If the Embed Script check box is selected, the supplied script file will be copied into the alarm configuration. This is particularly useful when a monitor should be run on a server or distributed to other MIB Explorer instances, because one need not to deploy the script file separately. A disadvantage of using embedded scripts is the fact that embedded scripts cannot be changed by changing a single file per MIB Explorer instance.
With Edit, an embedded script can be viewed and changed.
To test a script, click on the Test button and the supplied script will be executed as if the given condition would be true. The values presented to the script are taken from the most recent row of the primary values table.
Value
Specifies the alarm text or alarm value that provides further information about the alarm. The alarm text may include formatted arithmetic expressions placed between brackets { and }. The brackets will not be part of the output text but replaced by the result of the entered expression. For example, an alarm text value
"This is the series average: {AVERAGE(Z?:Z0)}"
will result in the following text if the series average is 100.0:
"This is the series average: 100.0"
|
Chart Type |
Description |
|---|---|
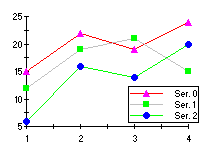
PLOT |
Each series is drawn as connected points of data.
|
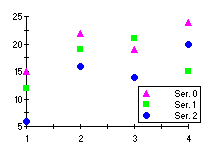
SCATTERED PLOT |
Each series is drawn as unconnected points of data.
|
|
AREA 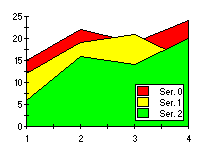
|
Each series is drawn as a bar in a cluster. The number of clusters is the number of points in the data. Each cluster displays the n-th point in each series.
|
|
STACKING AREA 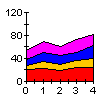
|
Each series is drawn as connected points of data, filled below the points. Eeach series is placed on top of the last one to show the area relationships between each series and the total.
|
|
BAR 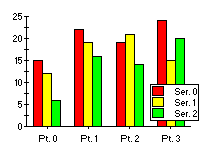
|
Each series is drawn as a bar in a cluster. The number of clusters is the number of points in the data. Each cluster displays the n-th point in each series.
|
|
STACKING BAR 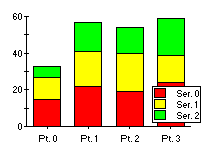
|
Each series is drawn as a portion of a stacked bar cluster, the number of clusters being the number of data points. Each cluster displays the n-th point in each series. Negative Y-values are stacked below the X-axis.
|
|
PIE 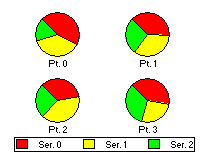
|
Each series is drawn as a slice of a pie. The number of pies is the number of points in the data. Each pie displays the n-th point in each series.
|
|
HILO 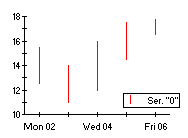
|
Two series are drawn together as a "high-low" bar. The points in each series define one portion of the bar:
The appearance is determined by line style color property in the first series of each pair. |
|
Chart Type |
Description |
|---|---|
|
BAR 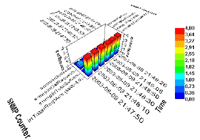
|
Each series is drawn as a series of 3D bars. Bars can be shaded, contoured, and zoned by elevation data (Z-axis).
|
|
SURFACE 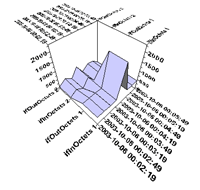
|
From the elevation data of all displayed series an (optionally shaded) surface is drawn.
|
|
SCATTER 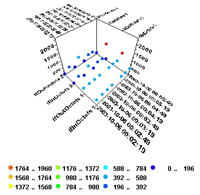
|
Each series is drawn as a series of points in the x,z plane, where x denotes the time and z the collected or computed value.
|
There are four types of expressions that can be used for monitor configuration: arithmetic, formatted arithmetic, boolean, and OID string expressions.
Within arithmetic expressions, values from the primary round robin database may be referenced. Like a spreadsheet application, this can be done by specifying simple references or regions:
Reference
A reference consists of a letter and an optional positive integer or question mark ("?"). The letters A-S refer to the columns of the primary data table (thus they refer to the rows of the configuration table). The integer value refers to the row in the data table, where 0 refers to the last row, 1 to the second to last row and so on. The question mark refers to the first row.
The special letter T refers to the time column which contains the number of milliseconds since January 1, 1970, 00:00:00 GMT.
Please note: Z may be used for legend and alarm configuration only!
The special letter Z refers to that column of the primary data table for which the expression has been entered.
Examples:
A1 refers to the second to last value of first series (if such a value exists).
Z refers to the last value of the series for which the expression has been entered.
Region
A region consists of two references where the first reference denotes the upper left corner of the region in the primary data table and the second reference denotes the lower right corner. Both references are concatenated by a colon (":"). Regions where the first and second reference do not follow the above rule are invalid.
Examples:
A?:A0 refers to all values of the first series.
Z?:Z0 refers to all values of the series for which the expression has been entered.
T1:T0 refers to the time values of the last two collected rows.
A?:E0 refers to all values of the first to fifth series.
Arithmetic Expressions
Arithmetic expressions evaluate to a scalar numerical value, for example "(1+2)*3^2" and "SUM(Z?-Z0)". The following unary and binary operators are supported and take precedence in the shown order (from highest to lowest):
^
+,- (unary)
%
/
*
+,-
The following functions are supported (operands might be scalar values, expressions, references, or regions):
|
Operation |
Description |
|---|---|
|
ABS(s) |
Return the absolute value of scalar operand. |
|
AVERAGE(r1[,r2]) |
Returns the sum of all elements divided by the number of elements. |
|
CEILING(r) |
Return the least integer greater than or equal to the operand, which may be a scalar or a list of values (region). |
|
COUNT(r1[,r2]) |
Return the total number of elements in its operands. |
|
COUNTWHEN(sumOID[,selOID,regex[,displayHint]]) |
Return the number of elements found in the subtree (i.e., column of a table) denoted by sumOID. If selOID and a regular expression regex are also given, only those objects in subtree of sumOID are counted where the corresponding value in subtree of selOID matches the given regular expression. For example, The OID(s) may be specified as "1.3.6.1.2.1.2.2.1.3" or "ifTable.1.3". With the optional displayHint string the display format defined for selOID can be overridden. For example, by specifying a display hint of "255a" OCTET STRING values will be compared as ASCII strings, by specifying "1x:" values will be compared as hexadecimal strings where each character is separated by a colon. The syntax of displayHint is the same as for the DISPLAY-HINT clause defined for SMIv2. Note: Use this function carefully since it could cause heavy load if used on large tables. |
|
DELTA(r,s) |
Return the delta between the last and second to last element of the value list r, which is r[n]-r[n-1]. If r contains only one element, then zero will be returned. If r[n]-r[n-1] is negative, a counter wrapping is assumed and the delta is computed as (s+(r[n]-r[n-1]))+1. If the region r contains cells for which no values could be retrieved (because of a timeout or an error returned by the agent) then those cells will be ignored. |
|
DELTA32(r) |
Return the delta between the last and second to last element of the value list r, which is r[n]-r[n-1]. If r contains only one element, then zero will be returned. If r[n]-r[n-1]is negative, a counter wrapping is assumed and the delta is computed as 
: If the region r contains cells for which no values could be retrieved (because of a timeout or an error returned by the agent), then those cells will be ignored. |
|
DELTA32(s1,s2) |
Return s2-s1 if this difference is not negative. If it is negative, then 
will be returned. |
|
DELTA64(r) |
Return the delta between the last and second to last element of the value list r, which is r[n]-r[n-1]. If r contains only one element, then zero will be returned. If r[n]-r[n-1]is negative, a counter wrapping is assumed and the delta is computed as 
: If the region r contains cells for which no values could be retrieved (because of a timeout or an error returned by the agent), then those cells will be ignored. |
|
DELTA64(s1,s2) |
Return s2-s1 if this difference is not negative. If it is negative, then 
will be returned. |
|
FLOOR(s) |
Return the greatest integer less than or equal to the scalar operand. |
|
GEOMETRICMEAN(r1[,r2]) |
Return the n-th root of the product of a set of n numbers. |
|
IF(cond,s1,s2) |
Return s1 if the boolean expression cond evaluates to true, otherwise s2 is returned. |
|
MAX(r1[,r2]) |
Return the largest element of one or two regions or the largest element of two scalars. |
|
MEDIAN(r1[,r2]) |
Return the middle element of a sorted list, or the average of the two middle values if the list has an even number of elements. |
|
MIN(r1[,r2]) |
Returns the smallest element of one or two regions or the largest element of two scalars. |
|
POWER(s1,s2) |
The exponentiation (^) operation. It takes two scalar values or expressions. The left operand (s1) is the base and the right operand (s2) is the exponent: 
|
|
PRODUCT(r1,r2) |
A product can be performed on a pair of elements or across a list. The product of a region is the product of its individual members. Multiplication order is left-to-right, and first element of a list to last element. The result of a matrix multiplication may depend on the order of the operands. |
|
ROOT(s) |
Return the positive square root of its operand: 
. |
|
ROUND(s) |
Return the nearest integer to the operand. Rounding is done to an even number if the operand is exactly midway between two integers. |
|
SORT(r1[,r2]) |
Return a sorted list of the given elements. Any secondary or nested lists are flattened. |
|
STDDEVIATION(r1[,r2]) |
The sample standard deviation, given by 
where n is the number of samples. |
|
SUM(r1[,r2]) |
Return the sum of two scalars or the sum across one or two regions: 
|
|
SUMWHEN(sumOID[,selOID, |
Return the sum of all (numerical) values found in the subtree (i.e., column of a table) denoted by sumOID. If selOID and a regular expression regex are also given, only those objects in subtree of sumOID are add up where the corresponding value in subtree of selOID matches the given regular expression. With the optional displayHint string the display format defined for selOID can be overridden. See also COUNTWHEN. Note: Use this function carefully since it could cause heavy load if used on large tables. |
|
TRUNC(s) |
Returns the integer part of a number. Equivalent to rounding to the nearest integer closer to zero. Example: trunc(-3.5) = -3 |
Formatted Arithmetic Expressions
A formatted arithmetic expression is an arithmetic expression enclosed in an optional FORMAT operation:
<formatted arithmetic expression>:
[FORMAT( <arithmetic expression>,
<decimal format string>
[, <minimum width>] )] | <arithmetic expression>
where <decimal format string> is a pattern string as described in the Java DecimalFormat class documentation, for example "#,##0" formats a positive number with no decimal digits and a separator. The optional <minimum width> positive integer specifies the minimum width in characters of the formatted string. If the formatted string's length is less than the specified number, spaces will be inserted at the beginning of the result string until it has the specified length.
Boolean Expression
A boolean expressions evaluates to a truth value: true or false. MIB Explorer supports several comparison operators that take one or two arithmetic expressions. These boolean operators take the following precedence (from highest to lowest):
<, >, <=, >=
==, !=
!
||, &&
All arithmetic operators take precedence over these boolean operators, for example the boolean expression
5 * 10 < 50 || (5 == 2+3)
evaluates to true.
OID String Expression
An OID string expression evaluates to an OID string, which is a dotted string of positive integers (e.g., "1.3.6.1.2.1.2.2.1.3.4976"). There is only one operator supported for OID string expressions:
+
The plus sign concatenates two OID strings by inserting a dot (".") between them. Thus, the expression
"1.3.6"+"1.2.1.2.2.1.3.4976"
will evaluate to "1.3.6.1.2.1.2.2.1.3.4976". In addition, MIB Explorer supports two very powerful operations to retrieve OID strings from a target:
|
Operation |
Description |
|---|---|
|
INDEXOF(oid, regex[,n,[displayHint]]) |
Searches all instances of the OBJECT-TYPE represented by oid for the n-th matching of the given regular expression regex with the value of the respective instance. If n is not specified, then the index of the first instance of oid that matches regex will be returned. The parameter oid may be an OID string ("1.3.6.1.2.1.2.2.1.3") or an object name with an OID string suffix ("ifTable.1.3"). In the latter case, the MIB module needed to resolve the object name must be loaded whenever the monitor is used! The optional parameter displayHint can be used to specify how the values of the instances of oid are converted to strings for matching with regex. For example, by specifying a display hint of "255a" OCTET STRING values will be compared as ASCII strings, by specifying "1x:" string values will be compared as hexadecimal strings where each character is separated by a colon.The syntax of displayHint is the same as for the DISPLAY-HINT clause defined for SMIv2. |
|
VALUEOF(oid) |
Returns the value of the MIB object instance represented by oid. The parameter oid may be an OID string ("1.3.6.1.2.1.2.2.1.3.4976") or an object name with an OID string suffix ("ifType.4976"). |
To configure the properties of a monitor, click on the Properties ( ) button of the monitor's main toolbar.
The following categories of settings are available (italic categories are available for 3D chart monitors only):
1.Chart
2.Chart Area
3.X Axis
4.Y Axis
5.Z Axis
6.Legend
7.Titles
8.Data
Chart Properties
Chart Type
Selects the chart type from eight supported basic types: Plot, Scatter Plot, Area, Stacking Area, Bar, Stacking Bar, Pie, and Hi-Lo.
Chart Name
Specifies the chart's name which is shown by the chart's legend (if visible). You may enter a single line of plain text or HTML formatted text. The HTML text has to start with <html> and end with </html>. Formatted arithmetic expressions may be placed within plain text as well as in HTML text between brackets { and }. The brackets will not be part of the output text but replaced by the result of the entered expression. For example, the chart name
<html><center>Chart Name<p>Maximum of A=
{FORMAT(MAX(A?:A0), "#,##0")}</center><tml>
will produce the following output:
Chart Name
Maximum of A=1.234
Foreground Color
Defines the foreground color for the chart.
Background Color
Defines the background color of the chart
Preferred Width
Specifies the width of the chart image in pixels when this monitor is run on a headless server. If a width of 0 pixels is given, a server will use either its built-in default value of 640 pixels or the width specified by the server's command line option.
Preferred Height
Specifies the height of the chart image in pixels when this monitor is run on a headless server. If a height of 0 pixels is given, a server will use either its built-in default value of 400 pixels or the width specified by the server's command line option.
Chart Area Properties
Font
The font for text printed within the chart area.
3D Effect (not available for 3D charts)
Depth
The depth property controls the apparent depth of a graph.
Elevation
The elevation property controls the distance above the x axis for the 3D effect.
Rotation
The rotation property controls the position of the eye relative to the y axis for the 3D effect.
3D Settings (not available for 2D charts)
Axis Scaling
The three axes (x,y,z) of a 3D chart can be individually scaled relative to each other.
Cube
Transparency
If selected, all lines of the objects (e.g. bars) within the 3D cube will be displayed.
Zoned
If selected, the distribution of the elevation data is shown.
Contoured
Displays data distribution by drawing contour lines demarcating each of the contour levels.
Meshed
If selected, the X-Y grid projected onto the 3D surface is displayed in a 3D view with a Z-axis.
Shaded
If selected data will be displayed as a flat shaded surface.
Shaded With Series Color
If selected, the color assigned to the respective chart series are used for shading.
Axis Properties
General
Title
The title for the axis. It can be specified as a plain text string or a HTML string, which has to start with <html> and end with </html>. In order to make the title visible you have to select the Visible check box.
Rotation
The rotation of the title.
Placement
The placement for the title relative to the axis.
Grid
The grid tab specifies the axis grid and whether it will be shown or not. The grid settings will have no effect on 3D charts.
Font
The font to be used for point labels and axis title.
Legend Properties
The legend of 2D charts is created from the Legend column of the Monitor Configuration. The legend of 3D charts is computed from the elevation data (z series) of the monitor.
General
Visible
If selected the legend will be displayed, otherwise it will be not visible.
Anchor
The anchor property specifies the location of the legend relative to the chart area.
Orientation
Set the orientation of the chart.
Font
Set the font used to print the legend.
Colors
In order to specify a background color for the legend the Opaque check box has to be selected. The foreground color can be specified in either way.
Titles Properties
Header
General
Set the header text, which can be specified as a single line of plain text or a multi-line HTML text. Select the Visible check box to make the header visible. Formatted arithmetic expressions may be placed within plain text as well as in HTML text between brackets { and }. The brackets will not be part of the output text but replaced by the result of the entered expression. For example, the chart name
<html><i>Chart Title</i>
<p>Total Average is {FORMAT(AVERAGE(A?:F0),
"#,##0", 10)}</center><html>
will produce the following output:
Chart Name
Total Average is 10.234
Font
Select the font for the header.
Colors
In order to specify a background color for the header the Opaque check box has to be selected. The foreground color can be specified in either way.
Footer
General
Set the footer text, which can be specified as a single line of plain text or a multi-line HTML text. Select the Visible check box to make the footer visible. As with header text, also the footer supports formatted arithmetic expressions.
Font
Select the font for the footer.
Colors
In order to specify a background color for the footer the Opaque check box has to be selected. The foreground color can be specified in either way.
Data Properties
The data properties define how SNMP data is collected and consolidated by the monitor and how that data is exported and saved to disk.
General
Data Coverage
The collected values can be stored as Absolute or as Delta values. Delta data coverage should be chosen for monitors that exclusively collect data from Counter, Counter32, and Counter64 objects. In delta mode, counter wrappings will be detected if a delta value is negative. Then the delta will be computed as described for the DELTA32 and DELTA64 operations (DELTA64 is used if syntax of collected object is Counter64).
All other monitors should use absolute data overage. If you want to collect absolute data, like temperature, and counter based values, like incoming packets, with the same monitor, then you should use absolute data coverage and add a computed series for each counter based value that computes its delta value using one of the available DELTA operations.
If delta coverage is selected, then the raw delta value can be put into ratio with the time delta by specifying a factor f unequally zero. A zero factor will disable the time ratio and the raw delta values will be stored (dv=(v0-v1)). Otherwise the delta will be computed according to the following formular:

where v0 denotes the last value collected and v1 the second to last value, t0 the time in milliseconds when the last value has been collected, t1 the time when the second to last value has been collected, and f denotes the specified factor (!=0). Thus, to collect delta values on a per second basis, use a factor of 1.
Data Source
By default, data is being collected by sending GET, GETNEXT or GETBULK requests to the target(s) configured for a monitor and collecting the values from the corresponding responses.
If the data that needs to be collected and monitored is sent by notifications, then a monitor can be configured to use passive data collection. In passive mode, a monitor listens for notifications on the listen address(es) configured for MIB Explorer's trap receiption. When it receives a notification, its ID is compared to the notification ID prefix configured for the monitor. If they match and the source IP address of the notification matches the target configured for the first series (A), then a new primary data row is appended to the primary data. Those values of variable bindings will be assigned whose OID match the OID prefix defined for a series while the series' target is empty or equals the source IP address of the notification.
Start Time
If given, the start time specifies when data collection for this monitor starts.
By specifying a date and time (yyyy-MM-dd HH:mm:ss) in the future and closing the monitor properties dialog with OK, the monitor will switch into run mode. Leaving the start time empty will allow a manual start of the monitor. When a monitor with a start time in the future is deployed to a server, then the server will start data collection for that monitor at the given time.
Round Start Time
Check this option, if you want to MIB Explorer to use a round start time when starting the monitor. A round start time is the next full minute, five minutes, ten minutes, fifteen minutes, half an hour, hour, six hours, twelve hours, or 24 hours - depending on the interval specified.
Interval
The update interval specifies the period in seconds between two consecutive data collections while the monitor is in run mode.
Fixed Rate
If checked, updates are scheduled for repeated fixed-rate execution, beginning at the specified time. Subsequent updates take place at approximately regular intervals, separated by the specified period.
In fixed-rate execution, each execution is scheduled relative to the scheduled execution time of the initial execution. If an execution is delayed for any reason (such as garbage collection or other background activity), two or more executions will occur in rapid succession to "catch up." In the long run, the frequency of execution will be exactly the reciprocal of the specified period.
If Fixed Rate is not checked, updates are scheduled for repeated fixed-delay execution. Subsequent executions take place at approximately regular intervals, separated by the specified period.
In fixed-delay execution, each execution is scheduled relative to the actual execution time of the previous execution. If an execution is delayed for any reason (such as garbage collection or other background activity), subsequent executions will be delayed as well. In the long run, the frequency of execution will generally be slightly lower than the reciprocal of the specified period.
Primary Samples
The maximum number of data points (rows) for all series in the primary round robin database.
Index Calculation
Specifies whether calculated index values should be cached for subsequent data collections or whether index values should be determined for each collection separately.
Consolidation
For each monitor an arbitrary number of consolidation round robin archives can be configured. To add a consolidation archive to the monitor press the Add button and a new row will be added at the end of the table. To remove a consolidation archive, select it and press the Remove button. Changes will not take effect until the monitor properties dialog is closed using the OK button. However, if the changes are saved, no undo is available and all data in any removed consolidation archives will be lost!
The properties of a consolidation archive are:
Name
The name of the consolidation archive. This name will be appended to the monitor name when primary and consolidation tables are exported and if the corresponding charts are exported. Thus, if you intend to export any data, you should avoid any special characters and use letters and digits only.
Function
Set the consolidation function to be used to create consolidation data points. The consolidation function takes a vector of primary data points, whose size is specified by Stepping, and computes a consolidated data point from it. Available functions are: AVERAGE, MAX, MIN, LAST, and SUM.
Samples
The (maximum) number of rows in the consolidation archive.
Stepping
The number of primary data points needed to create a consolidated data point.
Export
Export Directory
The directory where data table and charts should be exported to. If the specified directory is invalid or empty, data or chart export will not work. Please check the log, category "Monitor", for any errors.
Data File Type
Note: Even if the Enable button is selected no export takes place until the Export toggle button is selected.
Specifies whether data tables (primary as well as consolidated) should be exported as comma separated values (CSV) or XLS files whenever data is updated while the Export ( ) button is selected. Check the corresponding Enable button to enable export of data tables.
Chart File Type
Note: Even if the Enable button is selected no export takes place until the Export toggle button is selected. When running the monitor on a server, the export of the monitor configuration is always activated.
Specifies whether charts (primary as well as consolidated) should be exported as JPEG, GIF, PNG, PDF, PS, or PCL files whenever data is updated while the Export ( ) button is selected. Check the corresponding Enable button to enable export of charts.
Monitor
Enable the "Auto save monitor after data update" check box to save the monitor (including any uncommitted configuration changes) whenever new data is collected and (a) the Export ( ) toggle button is selected or (b) the monitor is being run on a server. With the option "Auto Save Interval" you can specify how many updates have to have been processed before an auto save is actually performed. A value of zero will save the monitor data each time new data has been collected.
With the option "Number of Backup Files" the number of backup files of the auto saved monitor configuration can be configured. No backup file is saved if the number is zero. Otherwise, up to the specified number backup files will be saved, where the file with the suffix .001 contains the next to last version.
Monitor Series Styles
To change the style of a series:
1.Select the Configuration node in the navigator tree.
2.Select the row representing the series to change by clicking on the row label.
3.Open the popup menu with the right-mouse button.
4.Choose Style... from the popup menu. A dialog with the tabs Line Style and Symbol Style will be opened.
5.Change the settings and press OK to save the changes.
Line Style
Set the color, width, and style of lines drawn for a series in the chart view. The selected line color will also be used for filling bars and areas.
Symbol Style
Set the color, shape, and size of symbols drawn by plot and scattered plot charts.
Monitor Toolbars

|
 Add New Data Point
Add a new row representing a series before the selected row. If no row is selected, the row will be added at the end of the monitor configuration (in order to remove any selection in the configuration table, press <ESC>).
 Duplicate Series
Duplicates the selected row in the monitor configuration table.
 Remove Selected Series
If the current view is the monitor's configuration, then remove the selected rows (series) from the monitor. The corresponding rows in the round robin databases, where collected and computed data is stored, will also be deleted when you commit your configuration changes by either selecting a data table or chart in the navigator tree or by choosing  from this toolbar.
If the current view is one of the data table views, then it removes the selected rows from the viewed data table. In contrast to the row deletion in the configuration view, this operation cannot be undone.
 Move Series Up
Move the selected series one position up in the configuration table. This will also move the corresponding columns in the data tables one position to the left when configuration is committed. Accordingly, this will also change the order of series in the charts' legends.
 Move Series Down
Move the selected series one position down in the configuration table. This will also move the corresponding columns in the data table one position to the right when configuration is committed. Accordingly,, this will also change the order of series in the charts' legends.
 Delete Collected Data
Empty all data tables of the round robin databases and charts.
 Collect Data Once (Not Available for Remote Monitors)
If there have been made any changes to the configuration of this monitor, you will be prompted to commit the changes to the data tables by deleting all data or by preserving existing data. Choosing the latter will have the following affect:
All columns referring to series that have been removed from the configuration will be removed from the series.
New series will be filled with null (no data) values.
Series that have been reordered in the configuration will also be reordered in data tables and charts.
Once changes have been committed, a new primary data row will be created in the primary data table and the corresponding series values will be collected and computed.
 Redo Last Change
 Undo Last Change
 Detach Monitor
Detach the monitor from the main window and show it in its own window. This can be useful if you want a custom size for the created chart(s).
 Attach Monitor
Reattach a previously detached window to the main window.
 Save As
Saves the displayed table, chart, or configuration (depending on the selected view) to a file. When the configuration view is selected, this function is the same as the Save As function from the basic monitor operations (“Basic Monitoring Operations” on page 112).
If a chart is displayed, it is saved as a JPEG, GIF, PNG, PDF, PS, or PCL file. If a data table is displayed, the table is saved as a XLS or CSV file. Which format is used, depends on the file extension for the target file.
 Monitor Properties
Configures the monitor properties, for example chart type and appearance, data coverage, update interval, number of samples, and data consolidation. Although, monitor properties may be changed while it is running, it is not recommended to change any data properties while a monitor is running.

|
 Start Monitor
Caution: If the monitor is a client monitor connected to a MIB Explorer server, then the server's monitor instance will be automatically updated with the new monitor configuration when committed.
Start the monitor. If there are any uncommitted changes to this monitor's configuration pending, then you will be prompted to commit the changes to the data tables by deleting all data or by preserving existing data.
Then the monitor collects one new primary data row from the configured target(s). This operation will repeated for each update interval as specified by the monitor properties.
 Stop Monitor
Stop the monitor. Data will no longer be updated regularly. If a client monitor is stopped, the server's monitor instance will be not affected. If you want to stop a monitor on the server, use the Connect dialog as described in “Basic Monitoring Operations” on page 112.
Progress Status
The progress status shows date and time when the next update will occur. At the same time, the progress bar shows the percentage of time elapsed for this interval waiting for the next update. If a client monitor is started, "Waiting for next remote update" will be displayed in the progress status bar until the next update on the primary data of the remote monitor has been propagated to the client.
 Export
Enable the export of data tables and charts. The export directory as well the export file types have to be specified with the monitor data export properties. Otherwise, enabling this option has no effect.
Note: If you want to integrate monitor chart images or data into a Web application, you should consider using the built-in HTTP server for performance reasons. In contrast to the monitor export feature the monitor HTTP chart and data servlets generate their output (images/files) only when requested.
Important note: The auto save mode will also save any configuration changes you make to the monitors configuration while it is running!
Table data can be exported to comma separated value (CSV) files and XLS files. Chart images can be exported as JPEG, GIF, PNG, PDF, PS or PCL files. If the auto save mode is enabled and export is selected, the monitor file will be saved whenever data is collected.
18.4Interactive Chart Customization
A monitor's chart view can be interactively customized by the user. The following interactions are provided:
moving the chart by holding down the <Shift> key while dragging the mouse with the left mouse button pressed
zooming into or out of the chart by holding down the <Alt> key while dragging the mouse with the left mouse button pressed
rotation of 3D charts or 2D bar or pie charts with 3D effect by holding down the <Ctrl> key while dragging the mouse with the left mouse button pressed
To reset a chart to its default view settings, select the chart view and press <Alt>+<R>.
The following relational databases are supported out-of-the-box for DBM monitors:
IBM DB2 9.5 or later.
PostgreSQL 9.0 or later.
If you want to use DBM monitors with other relational databases with JDBC driver support, you have two options:
1.Send an E-mail to support@agentpp.com and ask for supporting the database. Please provide name, version, and license type of the database.
2.Modify the existing DB mapping file and extend it for your database.
If you choose the second option, read the following sections on how to adapt the existing DB mapping to your SQL dialect.
Once you have extended the mapping XML file, you need to load it into MIB Explorer. See “Monitor” on page 25.
If you needed to extend the DB mapping file you will most likely also need to register an additional JDBC driver. This can be done in the Monitor section of the Preferences dialog too.
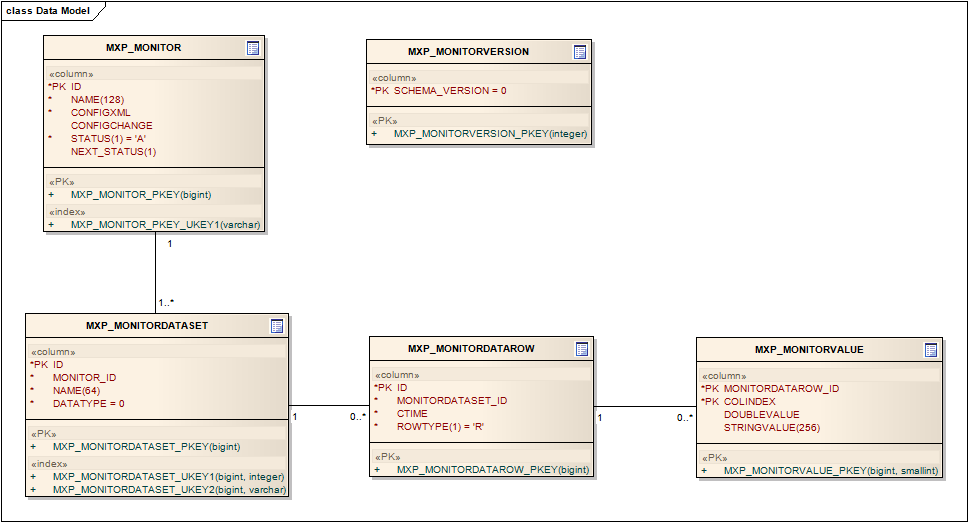
The database model is quite simple and is directly related to the XML monitor schema. The Settings and DataSeries elements of the MIBExplorerMonitor.xsd schema are stored as an XML file CLOB3 within the database. The Data element content is stored in lower three tables of the database model shown below.
|
18.5.1Database Mapping XML File
Instead of using a static object relational database mapping, MIB Explorer uses its own lightweight and easy configurable database mapping mechanism called SlimDAO4.
Basically a SlimDAO DB mapping configuration file contains SQL statements and their fragments in an XML file. Because the SQL dialects of different databases often differ only for special statements, like sequence and constraint creation, SlimDAO supports statement inheritance.
A SQL statement (or a complete script) can be defined in the default context „.“ and overwritten in a specific context whose name matches the JDBC driver class name for the database whose SQL dialect differs from the default context‘s dialect (e.g., org.postgresql.Driver for a PostgreSQL database).
Each statement and script in the mapping configuration has a unique name within its context. MIB Explorer will lookup a statement by its name. The name is hard-coded. The supported statement names are defined by the default context in the Monitor2DB.xml file from the db-monitor directory.
A statement is defined for example by the following construct:
<statement name="select.monitor.by.id">
SELECT * FROM @INSERT[SCHEMA].MXP_MONITOR
WHERE ID = @VALUE[ID]
</statement>
During runtime, MIB Explorer uses the statement to get monitor data from the database. It replaces the constructs of the pattern
@<TAG>[<PARAM_LIST>]
with the corresponding values as described by Table 16 on page 147. The resulting SQL statement would then be executed on the DB server as follows:
SELECT * FROM MXP.MXP_MONITOR WHERE ID = ?
The question mark (?) is a placeholder for the value within the prepared statement. The value will be inserted by the JDBC driver when the prepared statement is being executed. MIB Explorer sets the value for the statement by replacing the @VALUE[ID] reference with the ? in the statement and setting the statements first parameter value to the value of ID (for example 2).
The following table lists the available tags for monitor SQL statements.
|
Tag |
Description |
|---|---|
|
@VALUE[<param>] |
Replace the tag by ? in the statement and set the value of the prepared parameter to the value of the MIB Explorer variable with name <param>.
Example: SELECT ID FROM MXP.MXP_MONITOR WHERE NAME = @VALUE[NAME] will be rendered to SELECT ID FROM MXP.MXP_MONITOR WHERE NAME = ? where ? is assigned with the value of the MIB Explorer variable NAME when the statement is being executed. |
|
@INSERT[<param>] |
Replace the tag by the value of MIB Explorer variable with name <param>.
Example: SELECT ID FROM MXP.MXP_MONITOR WHERE NAME = ‘@INSERT[NAME]‘ will be rendered to SELECT ID FROM MXP.MXP_MONITOR WHERE NAME = ‘MyMonitor‘ if the variable NAME has the string value MyMonitor. |
|
@USE[<statementName>] |
Replace the tag with the rendered content of the statement with name <statementName> of the same context.
Example: <statement name="select.id"> SELECT ID </statement> <statement name="select.monitor.id.by.name"> @USE[select.id] FROM MXP.MXP_MONITOR WHERE NAME = @VALUE[NAME] </statement> will be rendered to SELECT ID FROM MXP.MXP_MONITOR WHERE NAME = ‘MyMonitor‘ if the variable NAME has the string value MyMonitor. |
|
@IF[<stmt>,<test>,<value>..] |
Replace the tag with the statement with name <stmt> if the condition <test> is true for the MIB Explorer variable references <value1> through <valueN>. The supported tests are listed in table Table 17 on page 149.
Example: <statement name="monitor.dataset.by.id"> SELECT * FROM MXP.MXP_MONITORDATASET WHERE MONITOR_ID = @VALUE[ID] @IF[and.nameOrDataType,not-null,NAME,DATATYPE] ORDER BY MONITOR_ID,DATATYPE </statement> <statement name="and.nameOrDataType"> AND (NAME = @VALUE[NAME] OR DATATYPE = @VALUE[DATATYPE]) </statement> will be rendered to SELECT * FROM MXP.MXP_MONITORDATASET WHERE MONITOR_ID = ? AND (NAME = ? OR DATATYPE = ?) ORDER BY MONITOR_ID,DATATYPE if the MIB Explorer variables NAME and DATATYPE are not null. |
|
@IFELSE[<stmtTrue>, <stmtFalse>,<test>, <value>..] |
Replace the tag with the statement with name <stmtTrue> if the condition <test> is true for the MIB Explorer variable references <value1> through <valueN>. Otherwise, replace the tag with the statement with name <stmtFalse>. The supported tests are listed in table Table 17 on page 149.
Example: <statement name="monitor.dataset.by.id"> SELECT * FROM MXP.MXP_MONITORDATASET WHERE MONITOR_ID = @VALUE[ID] @IFELSE[dataTypeNotNull,dataTypeNull,not-null,DATATYPE] </statement> <statement name="dataTypeNull"> AND DATATYPE IS NULL </statement> <statement name="dataTypeNotNull"> AND DATATYPE IS NOT NULL </statement> will be rendered to SELECT * FROM MXP.MXP_MONITORDATASET WHERE MONITOR_ID = ? AND DATATYPE IS NOT NULL if the MIB Explorer variables DATATYPE is not null. Otherwise, the statement would be rendered as: SELECT * FROM MXP.MXP_MONITORDATASET WHERE MONITOR_ID = ? AND DATATYPE IS NULL |
The tags @IF and @IFELSE insert a statement depending on the truth of a condition. The supported condition rules are listed by the following table.
As mentioned above, MIB Explorer provides a list of variables that can be accessed for each statement. MIB Explorer supports a fixed number of statements and scripts. The difference between statement and script is simple: Scripts may contain more than one SQL statement. Scripts are used to create the database schema used by MIB Explorer.
The statement separator string is the semi-colon (;) by default. You can specify a different one by using the separator attribute for the script XML element.
The scripts and statements that need to be implemented are listed in the table below. For most databases, you have only to reimplement the schema creation script and a few additional statements. Most statements can be inherited from the default context “.“.
You can change the default DB schema name by setting the property db.schema in MIB Explorer‘s configuration file.
The variable SCHEMA is available for all statements. It contains the schema name MIB Explorer uses for DB monitors. The default value is MXP..
|
Statement (Script) Name |
Variables/Parameters |
Description |
|---|---|---|
|
create.schema (Script) |
|
Schema creation script. |
|
check.schema |
|
Check if schema version matches the MIB Explorer version. |
|
select.monitor.by.id |
ID |
Select the monitor master values by its ID. |
|
select.monitor.keyValues.by.id |
ID |
Select the monitor key values (ID, name, and status) by its ID. |
|
select.monitor.id.by.name |
NAME |
Select the monitor master values by its name. |
|
list.monitors |
|
List the key values of all monitors. |
|
select.monitor.dataset.id |
MONITOR_ID |
Seelct the data set IDs of the monitor with the given MONITOR_ID. |
|
select.monitor.dataset.by.id |
ID[, NAME, DATATYPE] |
Get the datasets for a monitor. If NAME and DATATYPE are provided, return only the matching datasets. |
|
select.monitor.status.by.id |
ID |
Get the monitor status for the monitor with the given ID. |
|
select.monitor.rows.by.date |
ID, CTIME |
Get the monitor regular data rows for the monitor with the given ID which are newer than CTIME and from the primary data set. |
|
select.monitor.values.by.row |
ID |
Get the monitor values for the data row with the given ID. |
|
select.monitor.values.by.dataset |
ID |
Get the monitor values for rows of the data set with the given ID. |
|
select.monitor.rows.by.dataset |
ID |
Get the monitor rows of the data set with the given ID. |
|
update.monitor |
ID, NAME, CONFIGXML, NEXT_STATUS |
Update NAME, CONFIGXML, and NEXT_STATUS of the monitor with the given ID. |
|
update.next.status |
ID, NEXT_STATUS |
Update the NEXT_STATUS of the monitor with the given ID. |
|
update.monitor.status |
ID, STATUS, NEXT_STATUS |
Update the STATUS and NEXT_STATUS of the monitor with the given ID. |
|
update.monitor.dataset |
ID, NAME, DATATYPE |
Update the NAME and DATATYPE of the monitor data set with the given ID. |
|
insert.monitor |
ID, NAME, CONFIGXML, NEXT_STATUS |
Insert an new monitor into the DB. The last configuration timestamp is set to the current date and time. The status is set to started. |
|
insert.monitor.dataset |
ID, MONITOR_ID, NAME, DATATYPE |
Insert a new monitor data set. |
|
insert.monitor.row |
ID, MONITORDATASET_ID, CTIME, ROWTYPE |
Insert a new monitor data row. |
|
insert.monitor.value |
MONITORDATAROW_ID, COLINDEX, DOUBLEVALUE, STRINGVALUE |
Insert a new set of monitor row values. |
|
delete.monitor.by.id |
ID |
Delete the monitor with the given ID. |
|
delete.monitor.datasets.by.id |
ID |
Delete the monitor data set with the given ID. |
|
delete.monitor.rows.by.id |
ID |
Delete all rows for the monitor with the given ID. |
|
delete.monitor.rows.by.dataset_id |
MONITORDATASET_ID [, CTIME] |
Delete all rows for the monitor data set with the given MONITORDATASET_ID. If CTIME or ROWTYPE are given, delete only those rows with matching attributes. |
|
delete.monitor.rows.before |
MONITORDATASET_ID, CTIME[, ROWTYPE] |
Delete all rows for the monitor data set with the given MONITORDATASET_ID and a creation time before CTIME. If ROWTYPE is given, delete only those rows with matching type. |
|
delete.monitor.rows.by.date |
MONITORDATASET_ID, CTIME |
Delete all rows for the monitor data set with the given MONITORDATASET_ID and a creation time equal CTIME. |
|
delete.monitor.values.by.id |
ID |
Delete all monitor values for the monitor with the given ID. |
|
delete.monitor.values.by.dataset_id |
MONITORDATASET_ID [, CTIME] |
Delete all monitor values for the monitor data set with the given MONITORDATASET_ID. If CTIME or ROWTYPE are given, delete only those rows with matching attributes. |
|
delete.monitor.values.before |
MONITORDATASET_ID, CTIME[, ROWTYPE] |
Delete all values for the monitor data set with the given MONITORDATASET_ID and a creation time before CTIME. If ROWTYPE is given, delete only those rows with matching type. |
|
generate.id |
TABLE_NAME |
Generate a new ID for the specified TABLE_NAME. |
1. IBM and DB2 are trademarks of International Business Machines Corporation, registered in many jurisdictions worldwide.
2. DBM monitors are automatically reloaded completely if the configuration on the server changes incompatible with the current local configuration.
3. CLOB is a Character Large OBjec t database type.
4. SlimDAO stands for slim data access object